Calories and Metabolism
What Does “Moderately Active” Actually Mean? We Audited 12 Fitness Calculators
Written and fact checked by Muhammad Ali Akbar, MS-3, King Edward Medical University

The same 1.55 activity multiplier meant 2–3 workouts on one site, 3–5 on most, and 6–7 on another. Meanwhile, research-based PAL frameworks describe “sedentary” very differently from the convention used by many consumer calorie calculators.
Research date: August 12, 2026
Study type: Descriptive calculator-methodology audit + controlled sensitivity analysis
Sample: 12 external consumer calculator/guidance pages + official/reference PAL frameworks + 12 synthetic adult profiles
The short answer
When a calorie calculator asks whether you are sedentary, lightly active, moderately active or very active, it may look as though you are selecting a scientifically standardized category.
You usually are not.
VELOFITZONE audited 12 current calorie/TDEE calculator and guidance pages and found something unusual: the numbers were much more standardized than the meanings attached to them.
Among the 10 audited pages where we could directly verify the complete five-step numerical ladder in the retrievable page text, all 10 used the same familiar sequence:
1.20 → 1.375 → 1.55 → 1.725 → 1.90.
Yet the descriptions attached to those multipliers were inconsistent.
For the category corresponding to “moderately active”:
- 10 of 12 pages (83.3%) described approximately 3–5 exercise days per week.
- One current Omni Calculator page described the same 1.55 factor as moderate exercise 2–3 times per week.
- Healthline described 1.55 as moderate exercise 6–7 days per week.
That means two people performing the same weekly routine could reasonably choose different activity categories simply because the wording changed. (See Omni Calculator TDEE.)
And that matters because the activity factor directly multiplies estimated resting energy expenditure.
KEY FINDINGS
83.3% — 10 of 12 audited pages defined their moderate category as roughly 3–5 exercise days per week. 8.3% — 1 of 12 defined it as 2–3 times per week. 8.3% — 1 of 12 defined it as 6–7 days per week. For light activity, 75.0% — 9 of 12 used 1–3 days/week, while 25.0% — 3 of 12 used 1–2 days/week. Among pages where the entire five-step numerical ladder was directly visible, 10 of 10 used 1.20, 1.375, 1.55, 1.725 and 1.90.
10 of 12 — 83.3% mentioned occupation or a physical job somewhere in the activity scheme, but in 8 of 12 — 66.7% it appeared only at the highest activity tier.
None of the 12 standard activity schemes used a numerical daily step threshold.
None of the 12 standard schemes defined categories using explicit workout-duration thresholds in minutes or hours.
Calculator.net was a notable design exception outside the primary standard-label sample: it explicitly defines “exercise” as 15–30 minutes of elevated heart-rate activity, “intense exercise” as 45–120 minutes, and “very intense exercise” as 2+ hours (calculator.net).
The central finding is therefore not that activity multipliers are random.
It is almost the opposite:
The multiplier ladder is highly standardized. The interpretation of who belongs on each rung is not.
Why activity level matters so much
Most consumer TDEE calculators follow a structure similar to:
Predicted resting energy × activity factor = estimated daily energy expenditure
For example, NASM currently lists:
- 1.20 for sedentary
- 1.375 for lightly active
- 1.55 for moderately active
- 1.725 for very active
- 1.90 for super active.
The same five values are visible on ATHLEAN-X, Micron, MyProtein, Verywell Fit, Healthline, Runner's World, iCliniq and tdee.is, while Omni uses that same five-value backbone and adds a higher professional-athlete tier (nasm.org; omnicalculator.com; healthline.com).
So if the factor itself is often the same, why do users still get confused?
Because calculators do not observe your lifestyle.
You choose the factor for them.
And the words used to guide that choice differ.
How we conducted the audit
We reviewed 12 publicly accessible English-language consumer calculator or calculator-guidance pages on August 12, 2026.
The primary audit included NASM, Omni Calculator's TDEE calculator, TDEECalculator.net, ATHLEAN-X, Micron, MyProtein, Verywell Fit, Healthline, Runner's World, GymNation, iCliniq and tdee.is (nasm.org; myprotein.com; icliniq.com).
For each page we recorded, where available:
- the sedentary definition and multiplier;
- the light-activity definition and multiplier;
- the moderate definition and multiplier;
- the high and highest categories;
- exercise-frequency wording;
- whether occupation was considered;
- whether numerical daily steps were used;
- and whether exercise duration was explicitly quantified.
We separately examined Calculator.net as a design variant because its interface defines exercise using time-at-elevated-heart-rate thresholds rather than relying solely on the familiar light/moderate/hard wording (calculator.net).
We then compared the consumer terminology with reference PAL frameworks from FAO/WHO/UNU, EFSA and Australia's Eat for Health guidance. The Australian framework is particularly useful because its lifestyle table is adapted from doubly-labelled-water evidence, including the 574-measurement analysis by Black and colleagues (eatforhealth.gov.au).
Finally, we reused the 12 synthetic adult profiles from the previous VELOFITZONE Calculator Benchmark and held Mifflin-St Jeor BMR constant while changing only the PAL.
This is a descriptive methodology audit and sensitivity analysis.
It is not an accuracy trial and does not establish which consumer website estimates an individual's real energy expenditure most accurately.
Result 1: “Moderately active” did not have one meaning
The strongest consensus was:
moderately active = 3–5 exercise days per week.
Ten of the 12 audited pages used wording that fell into that category.
For example, NASM describes its 1.55 multiplier as moderate exercise or sports 3–5 days/week. Micron, MyProtein and iCliniq use essentially the same 3–5-day structure (nasm.org).
Runner's World similarly places recreational spirited running 3–5 days/week at 1.55 (runnersworld.com).
TDEECalculator.net's current menu labels “Moderate Exercise” as 3–5 days/week (tdeecalculator.net).
But there were two major exceptions.
Omni's current TDEE page maps: moderate exercise 2–3 times/week → 1.55 (omnicalculator.com).
Healthline maps: moderate exercise 6–7 days/week → 1.55 (healthline.com).
Those are not small semantic differences.
One page says a person exercising three times per week can fit its moderate category.
Another asks for six or seven days.
Yet both attach the label to the exact same numerical factor:
1.55.
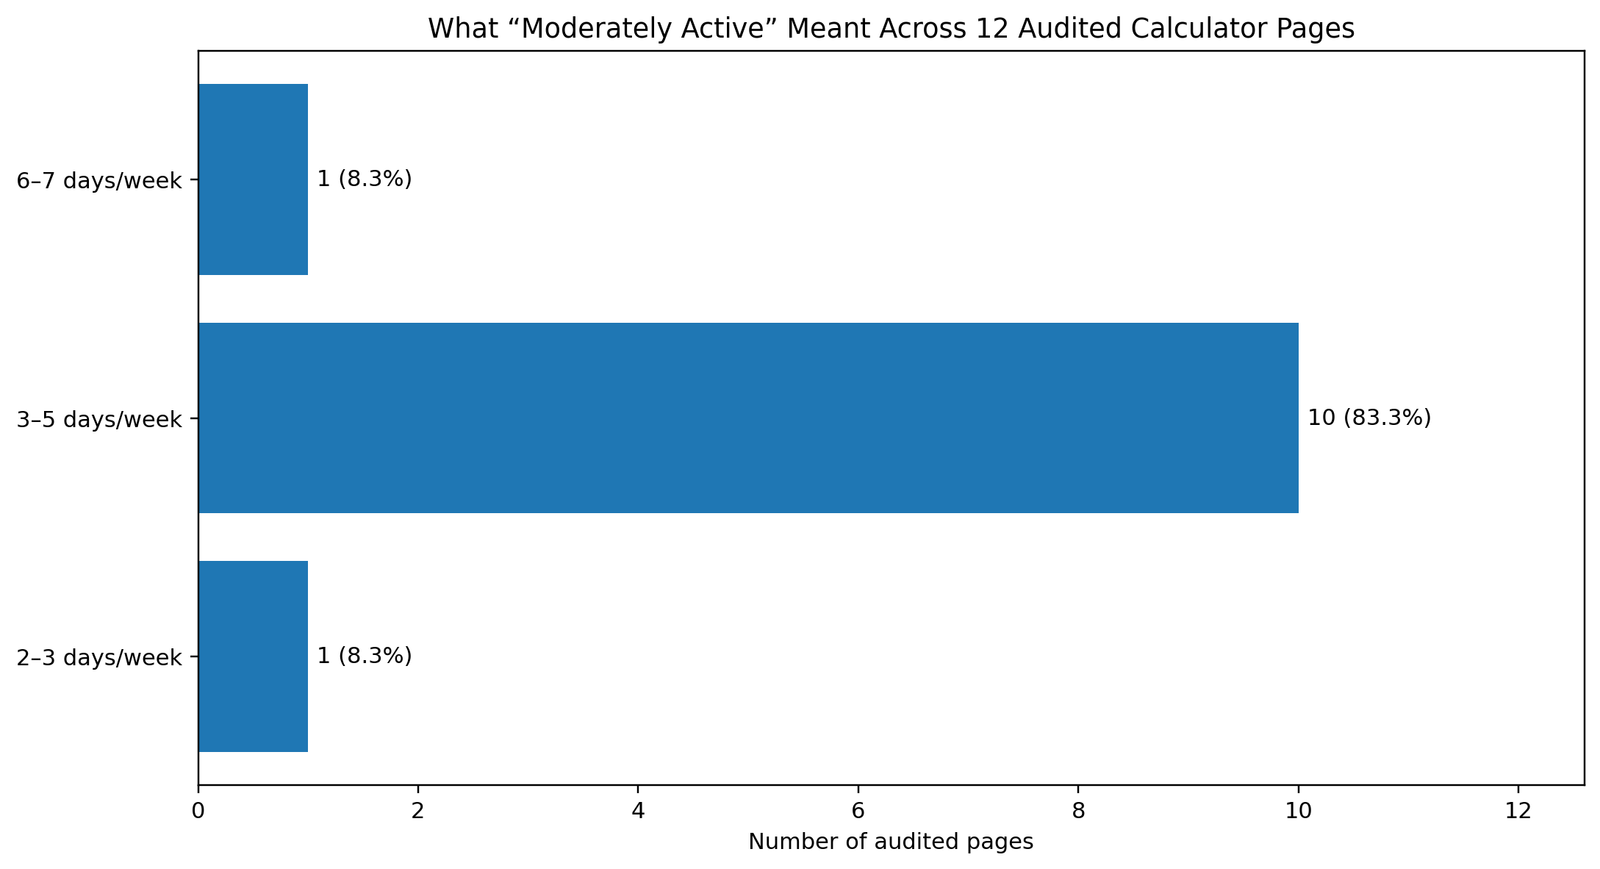
Source: VELOFITZONE Activity-Level Calculator Audit 2026
The chart shows:
- 2–3 days/week: 1 site
- 3–5 days/week: 10 sites
- 6–7 days/week: 1 site
The strangest example came from the same website
Omni provides an unusually clean demonstration of the problem.
On its current TDEE page, Omni says: 1.55 = moderate exercise 2–3 times/week (omnicalculator.com).
But its current Harris-Benedict calculator says: 1.55 = moderate exercise/sports 3–5 days/week (omnicalculator.com).
The mathematical multiplier did not change.
The brand did not change.
Only the explanation of who belongs in that category changed.
That is important because it shows that activity classification is not merely inconsistent between websites.
It can vary even between two educational tools on the same domain.
Result 2: the numbers were more consistent than the descriptions
This may be the most counterintuitive result of the entire audit.
Among the 10 primary audit pages whose full five-value activity ladder was directly retrievable, every one used the same core sequence:
| Activity rung | Common factor |
|---|---|
| Sedentary | 1.20 |
| Light | 1.375 |
| Moderate | 1.55 |
| High / very active | 1.725 |
| Highest / extra active | 1.90 |
Some sites add another athlete tier.
Omni, for example, adds a professional-athlete category above the standard sequence (omnicalculator.com).
But the core five multipliers were extraordinarily consistent across the pages where they were fully exposed.
This suggests that much of the consumer-calculator ecosystem has inherited a common numerical convention.
The weak point is not necessarily:
“What factor does this website use?”
It is often:
“What does the website tell the user they need to do to qualify for that factor?”
Result 3: “lightly active” also varied
Moderate activity was not the only disagreement.
Nine of the 12 pages — 75% — described light activity as roughly:
1–3 days of exercise per week.
Three pages — 25% — used:
1–2 days/week.
Omni, TDEECalculator.net and ATHLEAN-X used the narrower 1–2-day description (omnicalculator.com).
NASM, Micron, MyProtein, Verywell Fit, Healthline, Runner's World, GymNation, iCliniq and tdee.is used or included the wider 1–3-day pattern (nasm.org; runnersworld.com).
This creates an obvious boundary problem.
Consider someone with a desk job who trains three times per week.
One interface can invite that person into “light.”
Another can invite the same person into “moderate.”
And if the associated factors are 1.375 and 1.55, the difference is mathematically meaningful.
Result 4: consumer “sedentary” and scientific PAL “sedentary” are not the same concept
This is where the audit became much more interesting.
Most consumer calculators in our sample attach 1.20 to the sedentary category, usually describing it as little or no exercise.
For example, NASM uses little-to-no exercise at 1.20, Healthline uses little-to-no exercise at 1.20, and Micron combines little/no exercise with a desk job at 1.20 (nasm.org).
But official/reference PAL frameworks use the number very differently.
Australia's Eat for Health guidance states that PAL can range from 1.2 at bed rest to around 2.2 for very active/heavy occupational work, and says PAL values below 1.4 are incompatible with freely moving around and earning a living (eatforhealth.gov.au).
Its doubly-labelled-water-based lifestyle table places:
- 1.2 at rest, chair-bound or bed-bound;
- 1.4–1.5 at exclusively sedentary/seated work such as office employment;
- 1.6–1.7 at seated work with occasional walking and standing;
- 1.8–1.9 at predominantly standing or walking work;
- and 2.0–2.4 at heavy work or highly active leisure.
FAO/WHO/UNU similarly classifies a sedentary or light activity lifestyle as PAL 1.40–1.69, an active/moderately active lifestyle as 1.70–1.99, and a vigorous lifestyle as 2.00–2.40 (fao.org).
EFSA uses approximate adult PAL reference points of: 1.4 = low active/sedentary; 1.6 = moderately active; 1.8 = active; 2.0 = very active (efsa.europa.eu).
This does not prove that consumer calculators using 1.20 for sedentary are mathematically “wrong.”
It reveals something more subtle:
The word “sedentary” is being used in two different traditions.
In the consumer-calculator convention, it often means:
“I don't intentionally exercise.”
In whole-day PAL research frameworks, it describes the ratio of total daily energy expenditure to resting expenditure across an entire lifestyle.
Those are not interchangeable definitions.
Exercise is not the same thing as whole-day activity
This distinction explains why a weekly-workout menu can be misleading.
A person can perform four gym sessions per week and still spend most waking hours sitting.
Another person can perform no formal gym sessions but work on their feet for eight hours, walk for transportation, carry loads and perform household labor.
Which one is “more active”?
A dropdown based only on workout days cannot answer that reliably.
FAO explicitly frames PAL as habitual lifestyle activity, and its examples consider occupation, transportation, leisure activity and regular exercise together. It even gives an example in which roughly one hour of moderate-to-vigorous daily exercise can move an average PAL from about 1.55 to 1.75 (fao.org).
Australia's framework makes the same point from a different direction by organizing its PAL table primarily around whole-day lifestyle and occupational movement, then adding extra PAL units for strenuous sport (eatforhealth.gov.au).
So when a consumer calculator asks:
How many days do you exercise?
it is using exercise frequency as a shortcut for a much more complex quantity.
Figure 2: the semantic gap
The Same Activity Words Map to Different PAL Semantics
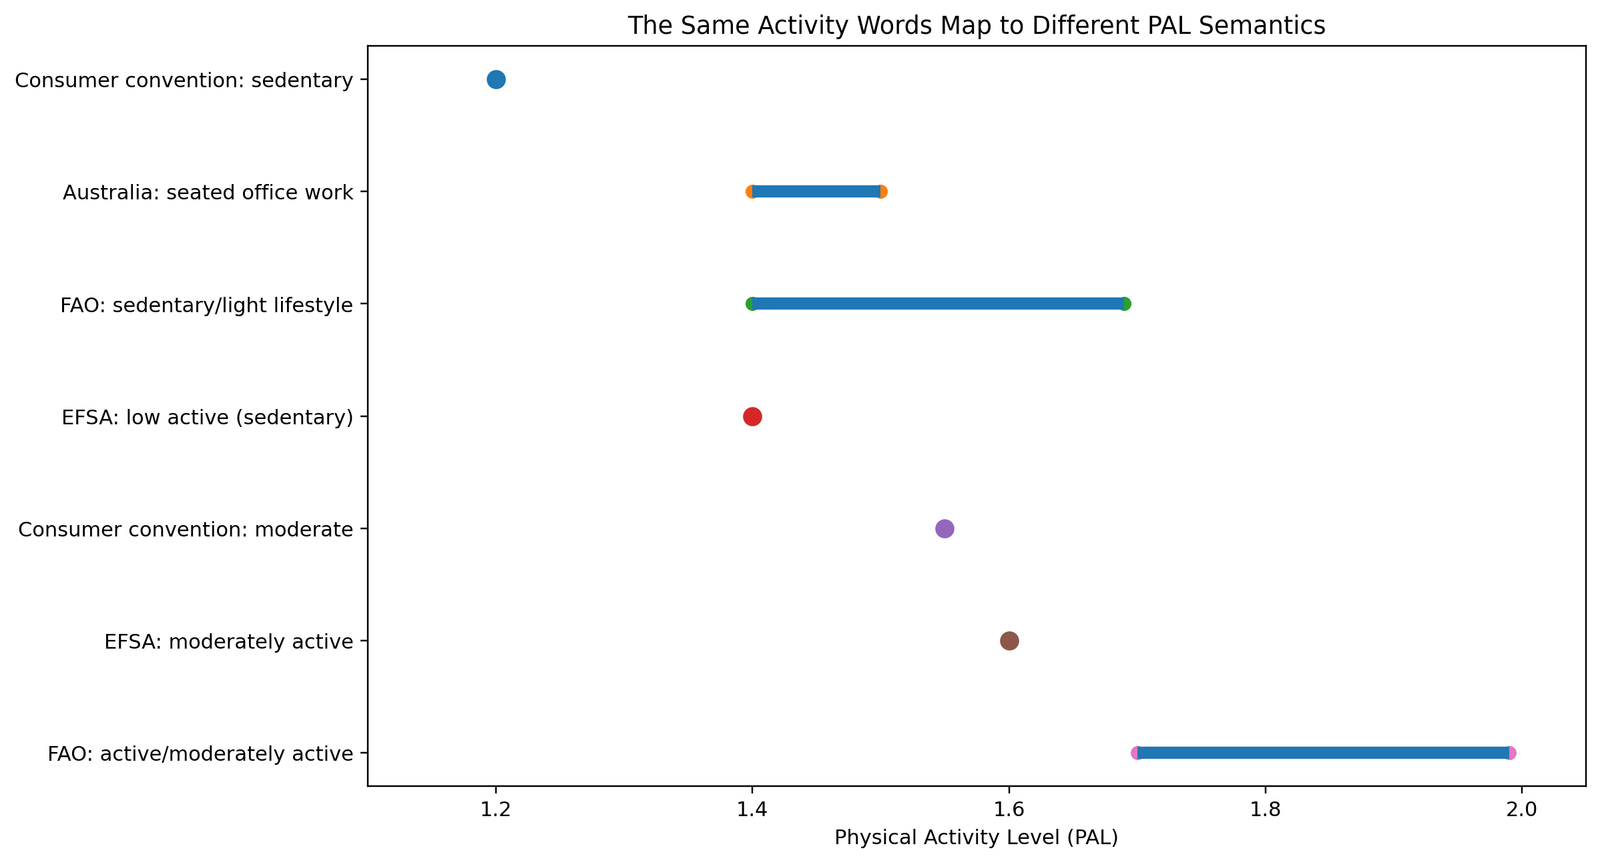
Source: VELOFITZONE Activity-Level Calculator Audit 2026
The figure compares:
- consumer convention: sedentary ≈ 1.20
- Australian seated office work ≈ 1.40–1.50
- FAO sedentary/light lifestyle = 1.40–1.69
- EFSA low active/sedentary ≈ 1.40
- consumer convention: moderately active ≈ 1.55
- EFSA moderately active ≈ 1.60
- FAO active/moderately active = 1.70–1.99.
The figure should not be interpreted as proof that all of those systems should return identical calorie values.
It illustrates that the labels themselves are not semantically standardized.
Result 5: almost every site mentioned occupation — but usually too late
Ten of the 12 audited activity schemes — 83.3% — mentioned a physical job or occupation somewhere.
That sounds encouraging.
But there was another pattern.
Eight of the 12 pages — 66.7% of the whole sample — introduced occupation only at the highest activity category.
NASM's highest category combines very hard exercise with a physical job. Micron, MyProtein, Healthline, Runner's World and iCliniq use comparable high-end wording (nasm.org).
That means many interfaces acknowledge occupational movement, but largely as something relevant only to very active users.
Two pages treated it more structurally.
tdee.is says its 1.725 category can mean either six or seven hard training sessions or a job that keeps you on your feet all day (tdee.is).
GymNation's live form explicitly combines exercise intensity and job type, distinguishing categories such as moderate exercise with a sedentary job from activity with an active job. Interestingly, its explanatory article on the same page still uses the more traditional workout-days language (gymnation.com).
That is probably closer to the real classification problem:
exercise and background movement are separate variables.
Result 6: none of the standard menus used step counts
Among the 12 primary activity definitions we audited:
0 of 12 used a numerical daily step threshold.
This does not mean steps are a perfect measure of energy expenditure.
They are not.
But the absence is notable because modern consumers frequently have access to step counts through phones and wearables, while calculator activity menus continue to rely heavily on subjective language such as:
- “light”
- “moderate”
- “hard”
- and “very active.”
tdee.is at least refers to “little walking,” but still does not quantify it (tdee.is).
A user who averages 2,500 steps and one who averages 9,500 steps could therefore select the same category if they report the same number of gym sessions.
That is a limitation of the interface, not necessarily of the underlying BMR equation.
Result 7: standard menus also ignored workout duration
None of the 12 standard-label schemes explicitly defined their main categories by a minimum number of workout minutes or hours.
A 20-minute session and a 90-minute session can therefore both count as:
“one workout day.”
That makes “3–5 days/week” surprisingly information-poor.
Calculator.net shows that a different design is possible.
Its current page explicitly defines: exercise: 15–30 minutes of elevated heart rate; intense exercise: 45–120 minutes; very intense exercise: 2+ hours (calculator.net).
We treated Calculator.net separately because this does not map cleanly onto the primary five-label sample, but its design highlights an important point:
frequency alone is not the only information a calculator could ask for.
How much can these choices change the calorie estimate?
To put the PAL differences into context, we reused the 12 synthetic adult profiles from the first VELOFITZONE Calculator Benchmark.
For each profile we calculated Mifflin-St Jeor BMR and changed only the PAL.
No age changed.
No height changed.
No body weight changed.
No BMR equation changed.
Across the 12 profiles:
Moving from PAL 1.20 to 1.40 changed estimated TDEE by an average of:
309.4 kcal/day
The profile-level range was approximately:
235.3 to 382.2 kcal/day.
Moving from 1.20 to 1.50 changed estimated TDEE by an average of:
464.1 kcal/day
with a range of approximately:
353.0 to 573.4 kcal/day.
Moving from the common consumer “moderate” factor of 1.55 to EFSA's approximate moderate reference point of 1.60 changed the estimate by:
77.3 kcal/day on average
with a range of:
58.8 to 95.6 kcal/day.
Moving from 1.55 to the lower boundary of FAO's active/moderately-active range, 1.70, changed estimated TDEE by:
232.0 kcal/day on average
with a range of:
176.5 to 286.7 kcal/day.
Again, these are sensitivity calculations, not evidence that one framework gives the true calorie requirement for each synthetic person.
They quantify how strongly a final calorie estimate responds when the PAL assumption changes.
A single synthetic example
Take one of our synthetic profiles:
- Male
- 25 years
- 175 cm
- 75 kg
Using Mifflin-St Jeor, estimated BMR is:
1,723.75 kcal/day.
Hold that BMR constant.
- At PAL 1.20: estimated TDEE ≈ 2,069 kcal/day
- At 1.40: ≈ 2,413 kcal/day
- At 1.55: ≈ 2,672 kcal/day
- At 1.60: ≈ 2,758 kcal/day
- At 1.70: ≈ 2,930 kcal/day
- At 1.725: ≈ 2,973 kcal/day
- At 1.90: ≈ 3,275 kcal/day
Nothing about the synthetic person changed.
The difference between the lowest and highest value in that illustration is over 1,200 kcal/day because the assumed level of whole-day activity changed dramatically.
That does not mean the plausible uncertainty for this real-world person is automatically 1,200 calories.
It demonstrates why activity classification deserves more attention than a casual dropdown click.
Figure 3: one profile, seven activity assumptions
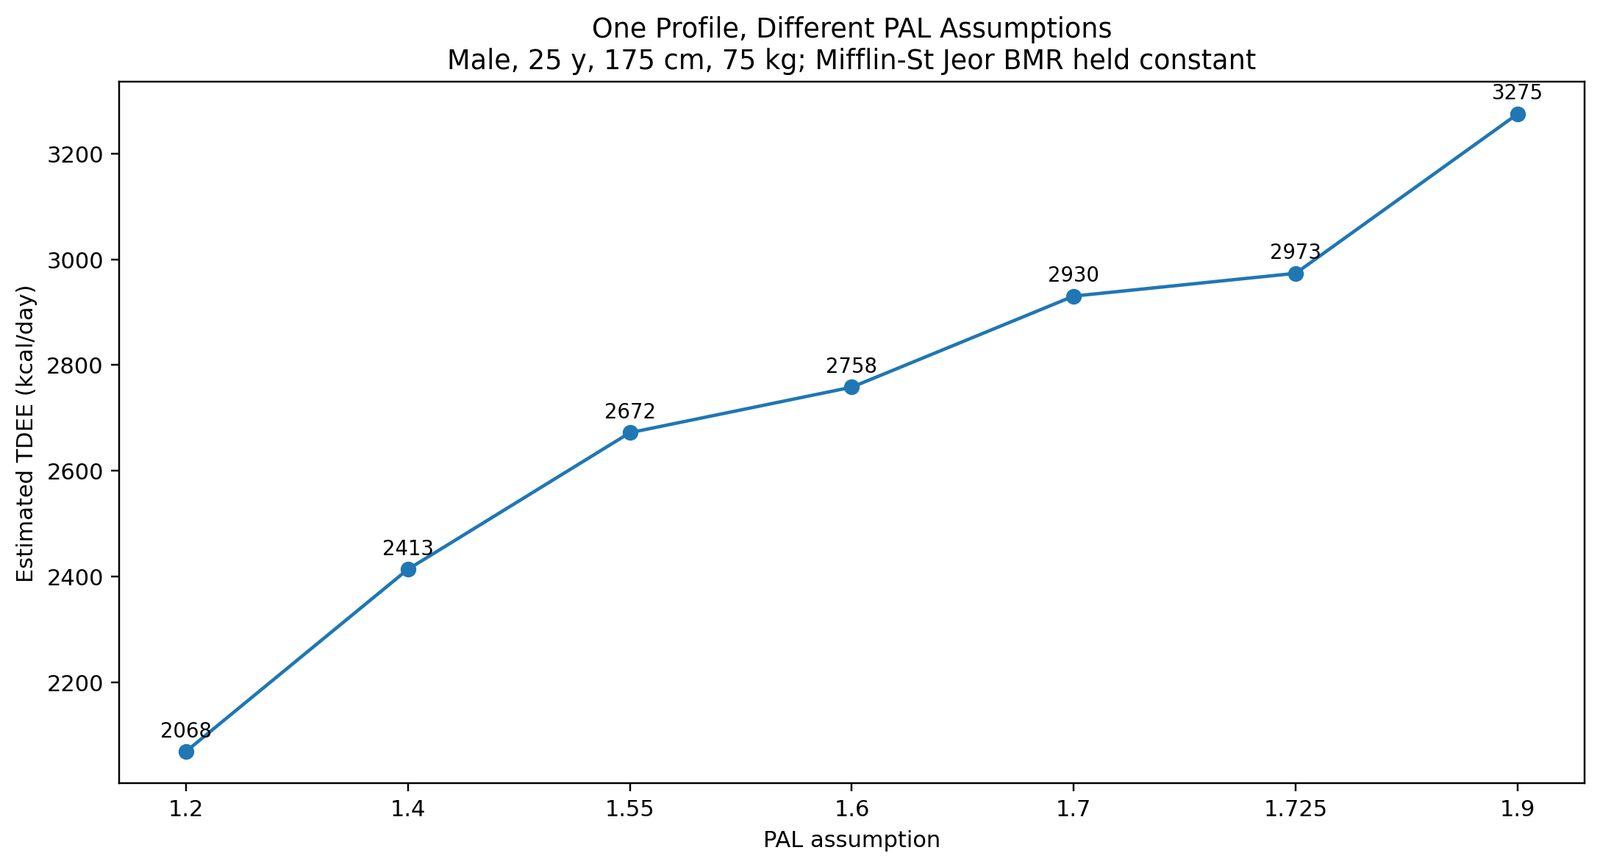
Source: VELOFITZONE Activity-Level Calculator Audit 2026
This figure is especially useful for editors and other websites because it makes the central finding instantly visible:
Same body. Same BMR equation. Different activity assumption. Different calorie estimate.
The biggest misconception: exercise days are not PAL
A weekly gym schedule is easy to ask about.
PAL is harder.
Physical Activity Level is fundamentally related to total daily energy expenditure relative to resting expenditure, not simply the number of days someone entered a gym.
The Australian guidance explicitly warns that individual energy requirements can vary substantially even among people with the same age, sex, body size and apparently similar activity levels, and recommends estimating PAL from actual usual activity patterns where possible (eatforhealth.gov.au).
That is why two people who both say:
“I work out four days per week”
may not belong at the same activity factor.
Person A:
- works from home;
- averages little walking;
- drives everywhere;
- performs four 45-minute resistance sessions.
Person B:
- works in a busy hospital;
- walks throughout the shift;
- uses stairs;
- commutes partly on foot;
- and performs the same four gym sessions.
Their exercise frequency is identical.
Their whole-day activity pattern is not.
A one-dimensional dropdown struggles to capture that distinction.
So are consumer calculators wrong?
That is not what this audit shows.
The familiar 1.20–1.90 ladder can be a practical heuristic.
It is simple.
Users understand it.
And an estimate does not need to reproduce an entire research protocol to be useful.
The problem starts when the interface creates an illusion that:
“moderately active” is an objective category with one universal definition.
Our audit found that it is not.
A better interpretation is:
the activity multiplier is a planning assumption selected from an imperfect description of a whole lifestyle.
That framing is both more accurate and more useful.
What should someone choose if they have a desk job but work out?
There is no universal answer that can be derived from workout frequency alone.
A person with a desk job who trains three or four times per week should consider at least:
- daily walking;
- time spent standing;
- occupation;
- commuting;
- household movement;
- exercise duration;
- exercise intensity;
- and how consistent that pattern is across a normal week.
This is also why VELOFITZONE's current activity-level guidance moves away from workout days alone and describes moderate activity in terms of meaningful daily movement plus regular training. See Am I Sedentary If I Work Out? How to Choose Your TDEE Activity Level and the TDEE Calculator.
The calculator output should then be treated as a starting estimate.
If food intake and body-weight trend are tracked consistently for several weeks, the observed trend provides information that another activity dropdown cannot.
What fitness calculators could do better
The industry does not necessarily need a more complicated BMR equation.
It may need a better activity interface.
A stronger TDEE calculator could separate two questions:
- What does your normal day look like outside exercise? Examples: mostly seated; some walking and standing; mostly standing/walking; physically demanding work.
- What structured training do you actually perform? Consider: frequency; duration; intensity; and possibly sport type.
A third optional signal could use recent typical step ranges — not as a direct calorie conversion, but as additional context for daily movement.
The user could then be shown:
- the selected PAL assumption
- and perhaps a nearby range rather than a falsely precise single category.
That would make the model more transparent.
What VELOFITZONE will change from this research
This audit should apply to us too.
VELOFITZONE uses the same general ecosystem of BMR and activity assumptions that this article is analyzing.
So the lesson should not be:
“Other calculators classify people badly.”
It should be:
“A one-question activity dropdown is inherently limited, including on our own tools.”
Our recommendation is to make the activity factor visible, distinguish daily movement from formal exercise, explain that activity labels are not universal, and encourage users to refine estimates from real-world trends.
That is a more useful outcome than declaring one multiplier “correct.”
Limitations
This audit has several important limitations.
First, it is a descriptive sample of 12 current external calculator/guidance pages, not a census of every calorie calculator on the internet.
The percentages therefore describe the audited sample and should not be generalized statistically to all fitness websites.
Second, pages can change their wording or calculation logic over time. The audit reflects versions accessible on August 12, 2026.
Third, some websites expose descriptive labels without exposing every underlying numeric multiplier in retrievable page text. We therefore separated semantic comparisons from the stricter analysis of pages where the complete numerical ladder was directly visible.
Fourth, a consumer “activity factor” does not necessarily have an identical conceptual implementation to a PAL used in a doubly-labelled-water reference framework. Comparing them is useful for understanding terminology and sensitivity, but it is not proof that a consumer calculator should simply replace 1.20 with 1.40.
Fifth, the 12 VELOFITZONE profiles are synthetic. The sensitivity analysis demonstrates mathematical consequences of different PAL assumptions; it does not measure the real energy expenditure of human participants.
Finally, TDEE itself varies from day to day. No static multiplier fully captures spontaneous movement, changing training volume, thermic effect of food, illness, sleep, seasonal behavior or individual physiology.
Conclusion
The activity dropdown may be one of the least transparent parts of a calorie calculator.
Our audit found an unusual combination:
the numerical ladder was highly consistent, while the definitions were not.
Most audited pages agreed that moderate activity means approximately 3–5 exercise days per week.
But not all.
The same 1.55 factor could mean:
- 2–3 sessions
- 3–5 sessions
- or 6–7 sessions
depending on the page.
And the deeper comparison showed that the consumer meaning of “sedentary” differs substantially from PAL classifications used in FAO, EFSA and doubly-labelled-water-based guidance (eatforhealth.gov.au).
For users, the practical lesson is simple:
- Do not treat the activity label as a measurement.
- Treat it as an assumption.
- Look at the number behind the label.
- Consider your entire day, not just the gym.
- And use the estimate as the beginning of the process rather than the final word.
Data availability
The coded calculator-level audit, publication figures and summary statistics for this analysis are available as the VELOFITZONE Activity-Level Calculator Audit 2026 dataset.
The dataset records the activity descriptions visible at the time of audit and retains the source URL for every row.
This project is designed to be reproducible: if a calculator updates its activity descriptions, the audit can be repeated and versioned.
Download the coded audit dataset (CSV): VELOFITZONE_Activity_Level_Audit_2026_Raw_Data.csv
Editorial note
This research compares published calculator methodologies and activity-classification frameworks. It does not diagnose energy requirements and does not identify a single activity factor as universally correct for an individual.
Predictive equations and PAL assumptions are best used as educational starting estimates. Individual nutrition or medical decisions may require assessment by an appropriately qualified professional.
Appendix: Coded Audit Summary
This appendix is not a substitute for the downloadable raw CSV. It gives a compact view of the 12-page audit sample used in the article.
| Site | Sedentary | Light | Moderate | Job mentioned? |
|---|---|---|---|---|
| NASM | Little to no exercise | Light exercise/sports 1–3 days/week | Moderate exercise/sports 3–5 days/week | Yes |
| Omni Calculator — TDEE | Little/no exercise (sedentary lifestyle) | Light exercise 1–2 times/week | Moderate exercise 2–3 times/week | Yes |
| TDEECalculator.net | Sedentary (office job) | Light exercise 1–2 days/week | Moderate exercise 3–5 days/week | No |
| ATHLEAN-X | Little to no daily exercise | Light movement or 1–2 days/week of training | 3–5 days/week of daily exercise | Yes |
| Micron | Little or no exercise, desk job | Light exercise 1–3 days/week | Moderate exercise 3–5 days/week | Yes |
| MyProtein | Little to no exercise | Light exercise or sports 1–3 days/week | Moderate exercise or sports 3–5 days/week | Yes |
| Verywell Fit | Little or no exercise | Exercise 1–3 days/week | Exercise 3–5 days/week | No |
| Healthline | Little to no exercise | Light exercise 1–3 days/week | Moderate exercise 6–7 days/week | Yes |
| Runner's World | Little or no exercise | Light/easy runs 1–3 days/week | Recreational spirited running 3–5 days/week | Yes |
| GymNation | Little or no exercise (article explainer) | Light exercise/sports 1–3 days/week; live form also combines exercise + sedentary job | Moderate exercise/sports 3–5 days/week; live form says intense exercise + sedentary job | Yes |
| iCliniq | Little or no exercise | Light exercise/sports 1–3 times/week | Moderate exercise/sports 3–5 times/week | Yes |
| tdee.is | Desk job, little walking, no training | 1–3 easy sessions/week; walking, yoga, gentle swim | 3–5 real sessions/week; gym, running, team sport | Yes |
Research downloads
The three research charts should be individually downloadable as high-resolution PNG files. Editors, journalists and educators may also republish them for editorial or educational use. Please credit “VELOFITZONE Activity-Level Calculator Audit 2026” and link to the original research page: https://velofitzone.com/fitness-guides/calories-and-metabolism/what-does-moderately-active-mean/
Research downloads and embed code
Figure 1 — Moderately Active Definitions
Figure 2 — PAL Framework Semantics
Figure 3 — TDEE Sensitivity Reference Profile
Free for editorial and educational reuse with attribution. Please credit VELOFITZONE Activity-Level Calculator Audit 2026 and link to the original research page.
Related reading: Why Fitness Calculators Disagree, How Many Calories Do I Burn a Day?, and the BMI and Body Composition cluster for body-composition context.
References
- National Academy of Sports Medicine (NASM). Resting metabolic rate / calorie guidance.
- Omni Calculator. TDEE Calculator.
- Omni Calculator. Harris-Benedict Calculator.
- TDEECalculator.net.
- Calculator.net. Calorie Calculator.
- MyProtein. Calorie calculator guidance.
- Healthline. How many calories should you eat per day?
- Runner's World. How many calories do I need?
- iCliniq. Calorie calculator.
- tdee.is.
- GymNation. TDEE calculator guidance.
- Australian Government / Eat For Health. Dietary energy.
- FAO/WHO/UNU. Human energy requirements — Physical activity level.
- EFSA Panel on Dietetic Products, Nutrition and Allergies. Scientific Opinion on Dietary Reference Values for energy.
- VELOFITZONE. Why Fitness Calculators Disagree (Calculator Benchmark 2026).