Calories and Metabolism
Why Fitness Calculators Disagree
Written and fact checked by Muhammad Ali Akbar, MS-3, King Edward Medical University
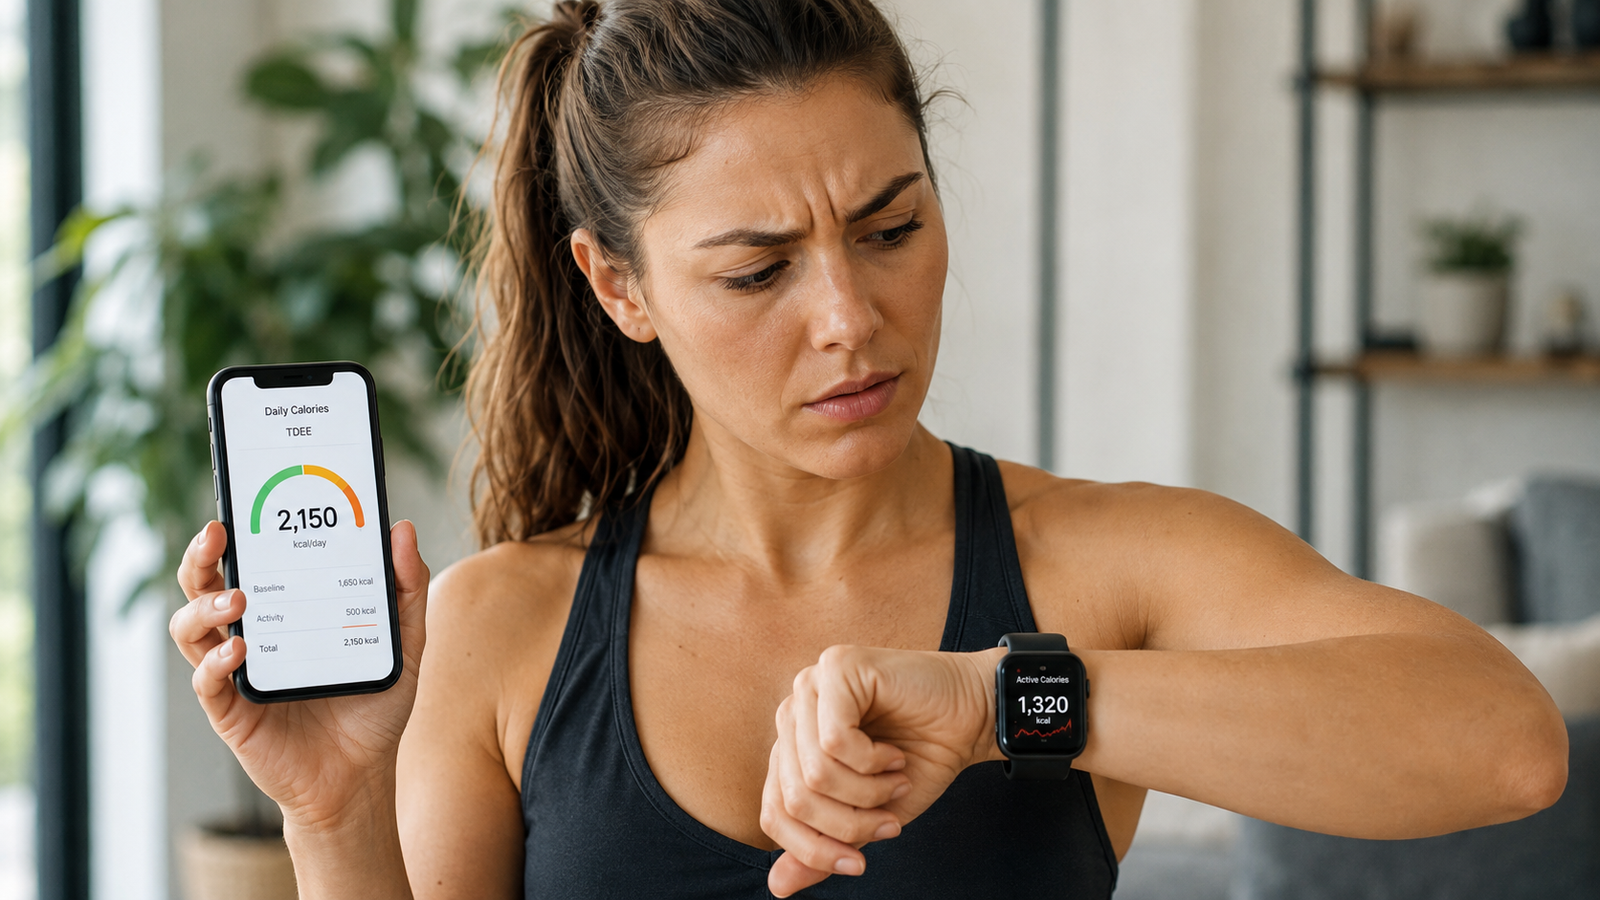
We tested 12 synthetic profiles across three BMR equations and multiple activity assumptions.
Research date: August 11, 2026 • Original VELOFITZONE benchmark • No personal data collected
KEY FINDING
Across 12 synthetic adult profiles, three published BMR equations differed by 85.2 kcal/day on average. Holding activity constant at PAL 1.60 increased the average TDEE spread to 136.3 kcal/day. Changing only PAL from 1.55 to 1.60 moved the estimate by 77.3 kcal/day on average.
The short answer
Fitness calculators disagree because they are often not performing exactly the same calculation. Two sites can ask for the same age, sex, height, weight and activity level yet use different resting-energy equations, different activity multipliers, or different definitions of labels such as “sedentary” and “moderately active.” When we held both the equation and the activity factor constant, the reconstructed arithmetic matched. The divergence appeared when one of those assumptions changed.
This is a benchmark of published methods, not a clinical accuracy trial. Because the profiles are fictional, there is no measured resting metabolic rate or total daily energy expenditure to serve as ground truth. Our question is narrower: where do calculator estimates begin to diverge, and by how much?
If you want to estimate your own numbers, use the VELOFITZONE BMR Calculator first, then the TDEE Calculator. For help choosing an activity level, see Am I Sedentary If I Work Out? How to Choose Your TDEE Activity Level.
What we tested
We created 12 synthetic adult profiles spanning ages 22–65, heights 158–185 cm and body weights 52–100 kg. These profiles are controlled test cases designed to expose how formulas behave; they are not intended to represent the population.
| Profile | Sex | Age | Height (cm) | Weight (kg) |
|---|---|---|---|---|
| P01 | Female | 22 | 160 | 52 |
| P02 | Female | 35 | 165 | 70 |
| P03 | Female | 50 | 168 | 85 |
| P04 | Male | 22 | 170 | 65 |
| P05 | Male | 35 | 180 | 85 |
| P06 | Male | 50 | 185 | 100 |
| P07 | Female | 25 | 170 | 60 |
| P08 | Female | 40 | 158 | 80 |
| P09 | Female | 65 | 162 | 65 |
| P10 | Male | 25 | 175 | 75 |
| P11 | Male | 40 | 172 | 95 |
| P12 | Male | 65 | 178 | 78 |
For every profile we calculated resting energy expenditure with Mifflin-St Jeor, Revised Harris-Benedict and the age- and sex-specific weight-only Schofield equations. Calculator.net publishes both Mifflin-St Jeor and Revised Harris-Benedict equations, while the Australian/New Zealand Eat For Health framework uses Schofield-based BMR predictions in its energy-requirement methodology.
Finding 1: same equation + same activity factor = same arithmetic
This is important because it tells us where disagreement does not originate. NASM publishes Mifflin-St Jeor and uses 1.20 for sedentary and 1.55 for moderately active. Omni’s simple calorie-intake calculator also uses Mifflin-St Jeor, but its moderate category uses 1.60. Calculator.net lets users select Mifflin-St Jeor or Revised Harris-Benedict and then applies an activity factor.
If two calculators use the same inputs, the same equation and the same multiplier, they should produce the same result apart from rounding or extra undisclosed implementation logic. The interesting differences begin when the assumptions change.
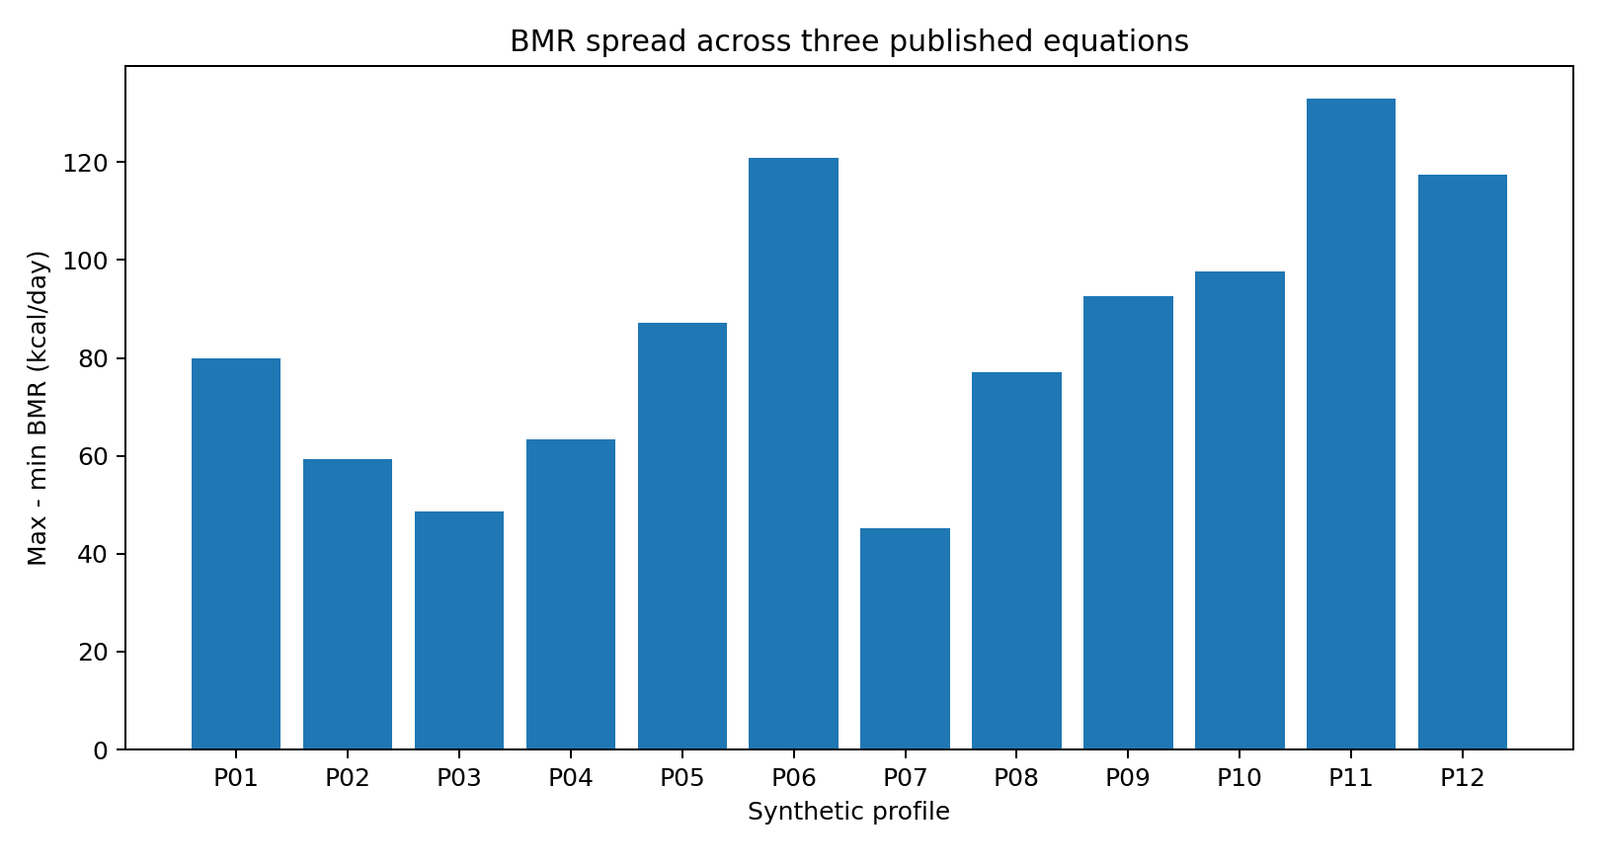
Finding 2: equation choice alone created an average BMR spread of 85.2 kcal/day
Across the 12 synthetic profiles, the mean difference between the highest and lowest resting-energy prediction was 85.2 kcal/day. The median spread was 83.5 kcal/day and the largest spread was 132.9 kcal/day. Relative to the mean BMR estimate for each profile, the average spread was 5.35%.
Source: VELOFITZONE Calculator Benchmark 2026
Profile-by-profile BMR results
| ID | MSJ | Rev. HB | Schofield | Lowest | Highest | Spread | Spread % |
|---|---|---|---|---|---|---|---|
| P01 | 1249.0 | 1328.9 | 1257.1 | 1249.0 | 1328.9 | 79.9 | 6.2% |
| P02 | 1395.2 | 1454.5 | 1414.4 | 1395.2 | 1454.5 | 59.3 | 4.2% |
| P03 | 1489.0 | 1537.6 | 1536.3 | 1489.0 | 1537.6 | 48.6 | 3.2% |
| P04 | 1607.5 | 1650.1 | 1670.9 | 1607.5 | 1670.9 | 63.4 | 3.9% |
| P05 | 1805.0 | 1892.2 | 1848.2 | 1805.0 | 1892.2 | 87.2 | 4.7% |
| P06 | 1911.2 | 2032.0 | 2020.3 | 1911.2 | 2032.0 | 120.8 | 6.1% |
| P07 | 1376.5 | 1420.8 | 1375.7 | 1375.7 | 1420.8 | 45.1 | 3.2% |
| P08 | 1426.5 | 1503.6 | 1495.7 | 1426.5 | 1503.6 | 77.1 | 5.2% |
| P09 | 1176.5 | 1269.1 | 1248.8 | 1176.5 | 1269.1 | 92.6 | 7.5% |
| P10 | 1723.8 | 1791.0 | 1821.5 | 1723.8 | 1821.5 | 97.7 | 5.5% |
| P11 | 1830.0 | 1959.4 | 1962.9 | 1830.0 | 1962.9 | 132.9 | 6.9% |
| P12 | 1572.5 | 1618.5 | 1501.2 | 1501.2 | 1618.5 | 117.4 | 7.5% |
The table does not tell us which equation is “correct” for any fictional profile. It demonstrates that equation selection itself can move the starting estimate before activity is considered.
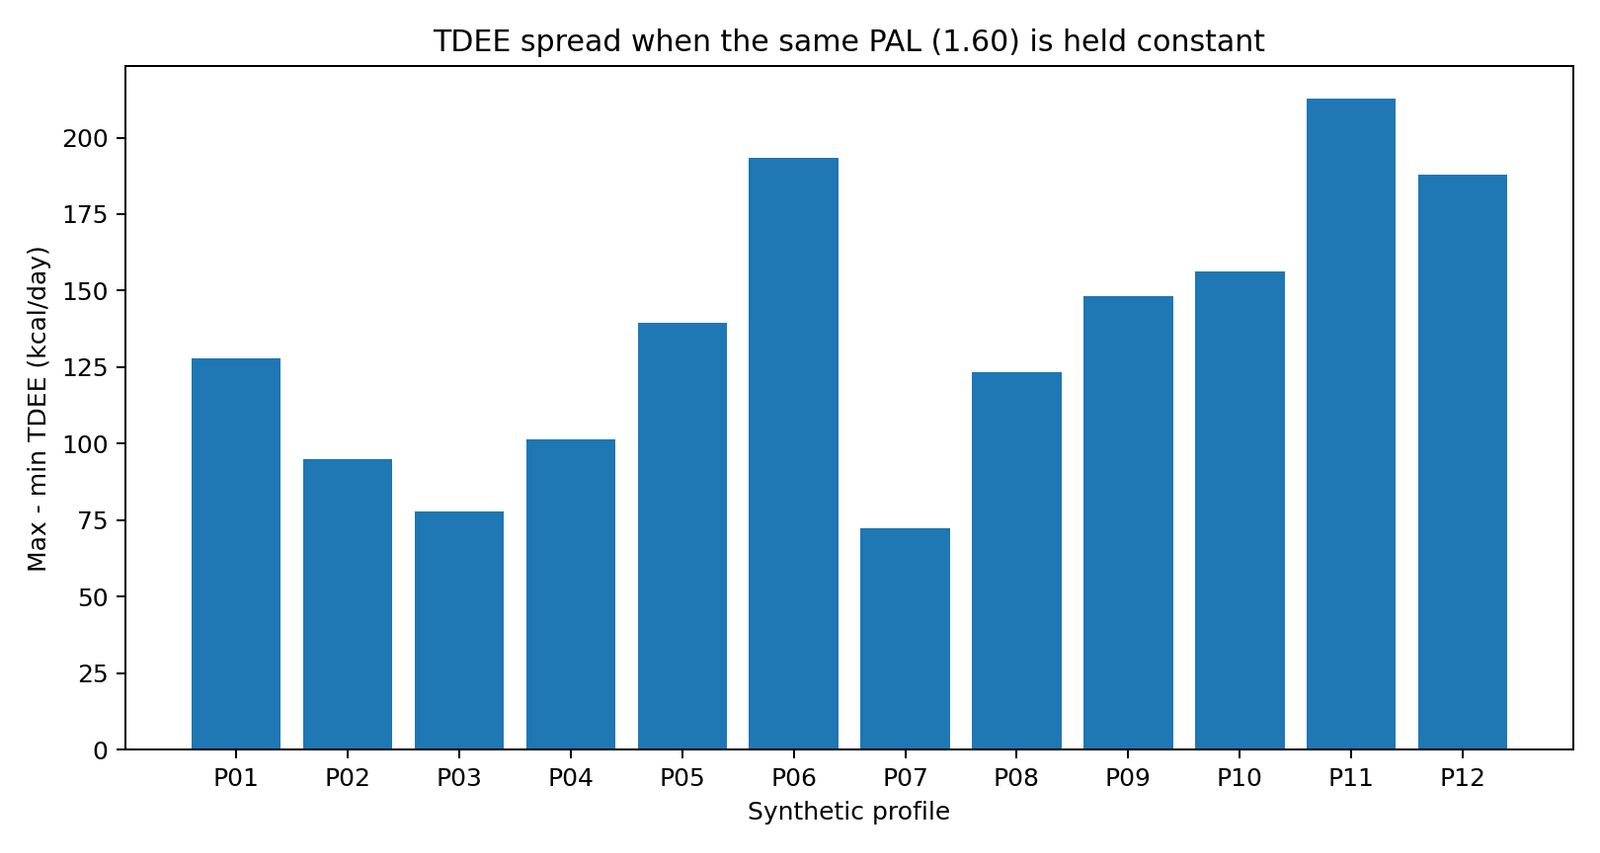
Finding 3: applying the same PAL amplified the equation-driven gap
We next multiplied all three BMR estimates by the exact same physical activity level: PAL 1.60. This isolates equation choice from activity choice. The average spread in estimated TDEE increased to 136.3 kcal/day, and the largest profile spread was 212.7 kcal/day.
Source: VELOFITZONE Calculator Benchmark 2026
Profile-by-profile TDEE results at fixed PAL 1.60
| ID | MSJ ×1.60 | Rev. HB ×1.60 | Schofield ×1.60 | Spread |
|---|---|---|---|---|
| P01 | 1998.4 | 2126.2 | 2011.4 | 127.8 |
| P02 | 2232.4 | 2327.2 | 2263.1 | 94.8 |
| P03 | 2382.4 | 2460.1 | 2458.1 | 77.7 |
| P04 | 2572.0 | 2640.2 | 2673.4 | 101.4 |
| P05 | 2888.0 | 3027.6 | 2957.2 | 139.6 |
| P06 | 3058.0 | 3251.2 | 3232.5 | 193.2 |
| P07 | 2202.4 | 2273.3 | 2201.1 | 72.2 |
| P08 | 2282.4 | 2405.8 | 2393.1 | 123.4 |
| P09 | 1882.4 | 2030.5 | 1998.1 | 148.1 |
| P10 | 2758.0 | 2865.7 | 2914.4 | 156.4 |
| P11 | 2928.0 | 3135.1 | 3140.7 | 212.7 |
| P12 | 2516.0 | 2589.7 | 2401.9 | 187.8 |
Finding 4: 1.55 versus 1.60 changed the estimate by 77.3 kcal/day on average
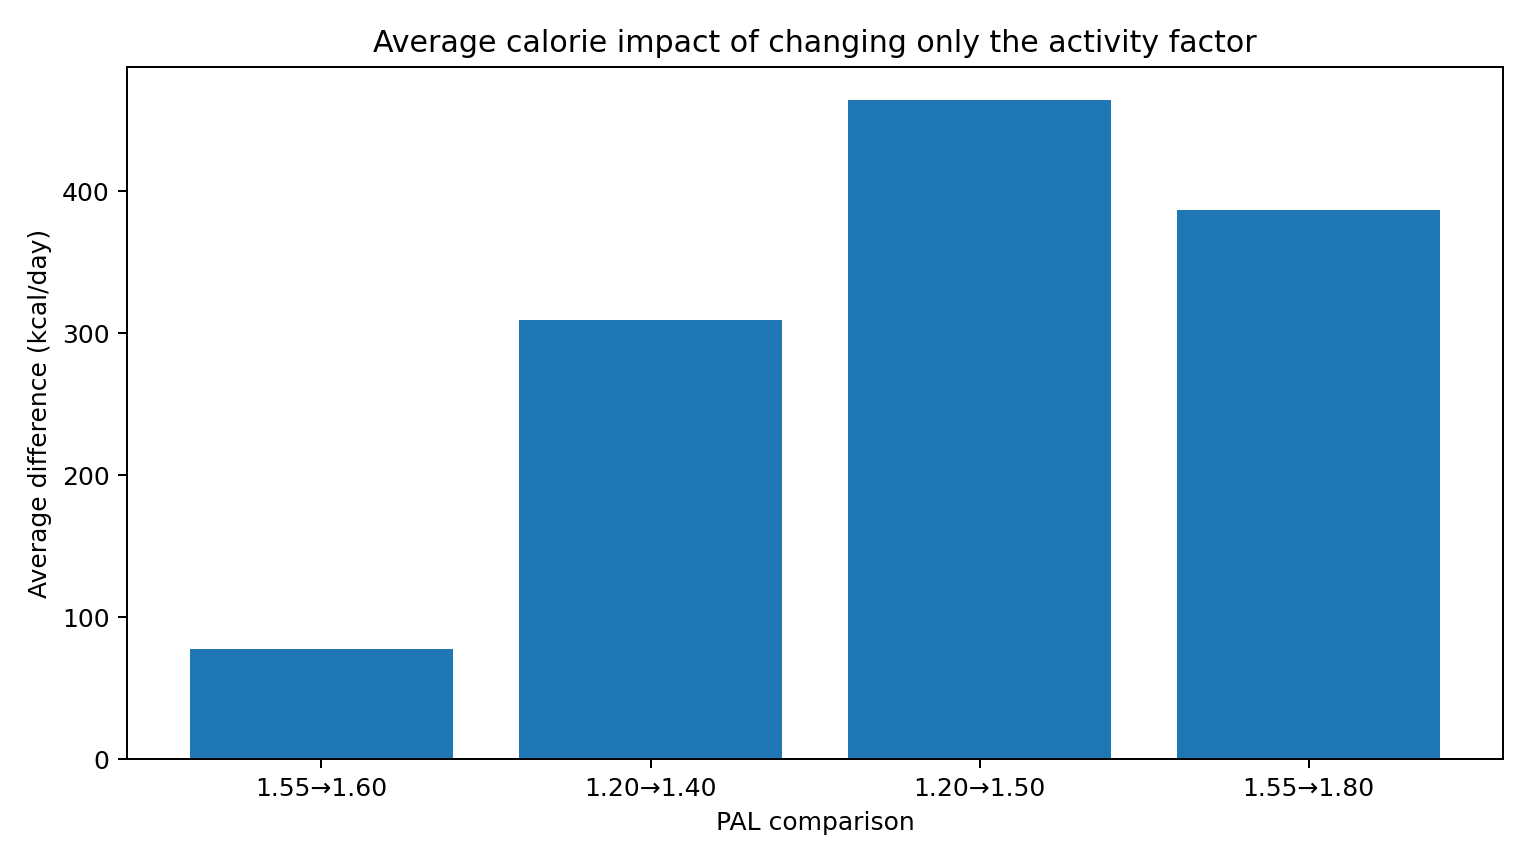
We then held the Mifflin-St Jeor BMR constant and changed only the activity multiplier. Moving from PAL 1.55 to 1.60 changed estimated maintenance calories by 77.3 kcal/day on average across the 12 profiles, with a maximum difference of 95.6 kcal/day.
This comparison matters because NASM’s published “moderately active” category uses 1.55, while Omni’s simple calorie-intake calculator uses 1.60 for moderate exercise two to three times per week. Both use Mifflin-St Jeor, so the difference can be isolated to the activity assumption.
Finding 5: what a calculator means by “sedentary” can matter even more
Activity labels are not standardized. Many consumer fitness calculators use 1.20 for a sedentary selection. The Eat For Health reference framework, however, describes PAL 1.20 as at-rest/bed-bound activity and lists exclusively sedentary seated work with little or no strenuous leisure activity around PAL 1.4–1.5.
Using the same Mifflin BMR for every profile, increasing PAL from 1.20 to 1.40 changed estimated expenditure by 309.4 kcal/day on average. Moving from 1.20 to 1.50 changed it by 464.1 kcal/day on average, with the largest profile difference reaching 573.4 kcal/day.
Source: VELOFITZONE Calculator Benchmark 2026
This does not establish that a particular PAL is correct for an individual. It shows why two tools can appear to ask a similar lifestyle question while assigning very different mathematical meaning to the answer.
Complete activity-sensitivity data
| ID | BMR | 1.20 | 1.40 | 1.50 | 1.55 | 1.60 | 1.80 | Δ1.55→1.60 | Δ1.20→1.50 |
|---|---|---|---|---|---|---|---|---|---|
| P01 | 1249.0 | 1498.8 | 1748.6 | 1873.5 | 1936.0 | 1998.4 | 2248.2 | 62.5 | 374.7 |
| P02 | 1395.2 | 1674.3 | 1953.3 | 2092.9 | 2162.6 | 2232.4 | 2511.5 | 69.8 | 418.6 |
| P03 | 1489.0 | 1786.8 | 2084.6 | 2233.5 | 2308.0 | 2382.4 | 2680.2 | 74.5 | 446.7 |
| P04 | 1607.5 | 1929.0 | 2250.5 | 2411.2 | 2491.6 | 2572.0 | 2893.5 | 80.4 | 482.3 |
| P05 | 1805.0 | 2166.0 | 2527.0 | 2707.5 | 2797.8 | 2888.0 | 3249.0 | 90.3 | 541.5 |
| P06 | 1911.2 | 2293.5 | 2675.8 | 2866.9 | 2962.4 | 3058.0 | 3440.2 | 95.6 | 573.4 |
| P07 | 1376.5 | 1651.8 | 1927.1 | 2064.8 | 2133.6 | 2202.4 | 2477.7 | 68.8 | 413.0 |
| P08 | 1426.5 | 1711.8 | 1997.1 | 2139.8 | 2211.1 | 2282.4 | 2567.7 | 71.3 | 428.0 |
| P09 | 1176.5 | 1411.8 | 1647.1 | 1764.8 | 1823.6 | 1882.4 | 2117.7 | 58.8 | 353.0 |
| P10 | 1723.8 | 2068.5 | 2413.2 | 2585.6 | 2671.8 | 2758.0 | 3102.8 | 86.2 | 517.1 |
| P11 | 1830.0 | 2196.0 | 2562.0 | 2745.0 | 2836.5 | 2928.0 | 3294.0 | 91.5 | 549.0 |
| P12 | 1572.5 | 1887.0 | 2201.5 | 2358.8 | 2437.4 | 2516.0 | 2830.5 | 78.6 | 471.8 |
Where fitness-calculator disagreement actually enters
- Inputs — Age, sex, height and weight can be identical.
- Resting-energy equation — The site may choose Mifflin-St Jeor, Revised Harris-Benedict, Schofield, Katch-McArdle or another model.
- Activity definition — The words attached to an activity category can differ from site to site.
- Activity multiplier — Nearby factors such as 1.55 and 1.60 still produce different results.
- Additional implementation — Rounding, workout-specific adjustments, body-fat inputs or other logic can add further variation.
Validation checks
We validated the reconstruction approach using a published worked example from Omni’s simple calorie-intake calculator. For a 50-year-old woman, 165 cm tall and 65 kg, with light exercise and PAL 1.40, Omni publishes 1,778.4 kcal/day. Applying its disclosed Mifflin-St Jeor equation and PAL independently reproduces the same result after rounding.
Calculator.net publishes the exact Mifflin-St Jeor and Revised Harris-Benedict equations it uses and states that the resting estimate is multiplied by an activity factor. This makes it suitable for a controlled equation-comparison benchmark.
We did not force every popular calculator into the dataset. A calculator was excluded from exact reconstruction when its implementation contained additional logic that was not sufficiently disclosed. This reduces brand count but improves reproducibility.
Does this mean calorie or TDEE calculators are useless?
No. A calculator can provide a practical starting estimate when its assumptions are transparent. The problem is treating a predicted number as if it were a direct laboratory measurement.
The original Mifflin-St Jeor study developed a predictive resting-energy equation from measured data, while later research comparing prediction equations with measured resting metabolic rate found that Mifflin-St Jeor performed relatively well overall but still produced meaningful individual errors. Prediction equations are useful estimates; they are not direct measurements.
Practical takeaway: use one transparent method consistently, treat the result as a starting estimate, and compare it with real-world trends over time. If you want to calculate a starting estimate using VELOFITZONE’s current method, use the TDEE Calculator or Calorie Calculator.
What this benchmark found
- Three BMR equations differed by 85.2 kcal/day on average across 12 synthetic profiles.
- The median BMR spread was 83.5 kcal/day; the maximum was 132.9 kcal/day.
- At the same PAL of 1.60, the average TDEE spread was 136.3 kcal/day and the maximum was 212.7 kcal/day.
- Changing only PAL from 1.55 to 1.60 moved the estimate by 77.3 kcal/day on average.
- Changing only PAL from 1.20 to 1.40 moved the estimate by 309.4 kcal/day on average.
- Changing only PAL from 1.20 to 1.50 moved the estimate by 464.1 kcal/day on average.
- Activity-label definitions can therefore be as important as the BMR equation when explaining why two calculators disagree.
Methodology
Design: deterministic benchmark using 12 synthetic adult profiles. No real user, patient or participant data were collected. For the equation-controlled analysis, Mifflin-St Jeor, Revised Harris-Benedict and Schofield were applied to the same profile inputs. For the TDEE equation comparison, a fixed PAL of 1.60 was applied to every equation. For the activity-sensitivity analysis, Mifflin-St Jeor BMR was held constant and PAL alone was varied among 1.20, 1.40, 1.50, 1.55, 1.60 and 1.80.
Outputs are reconstructed from published equations and activity factors unless explicitly described as a published worked example. The benchmark measures method-driven divergence; it does not test physiological accuracy against indirect calorimetry or doubly labeled water.
Limitations
- The 12 profiles are synthetic and are not a representative population sample.
- There is no measured energy expenditure for the fictional profiles, so the study cannot identify the physiologically most accurate estimate.
- Some consumer calculators include additional logic that is not fully disclosed; those pathways were not treated as exact live-output tests.
- Physical activity level is a modeling assumption. Two people with similar demographic inputs and similar self-described activity can still have different real energy expenditure.
- The benchmark reflects methods documented on August 11, 2026; calculator websites may change their formulas or activity categories later.
Research data transparency
All profile-level results used in this article are reproduced in the tables above. Do not create downloadable XLSX/CSV links unless those files are separately uploaded to the website later.
Download & Republish the Charts
The three research charts should be individually downloadable as high-resolution PNG files. Editors, journalists and educators may also republish them for editorial or educational use. Please credit “VELOFITZONE Calculator Benchmark 2026” and link to the original research page: https://velofitzone.com/fitness-guides/calories-and-metabolism/why-fitness-calculators-disagree/
Research downloads and embed code
Figure 1 — BMR Equation Comparison
Figure 2 — TDEE Spread at Fixed PAL 1.60
Figure 3 — Activity Factor Impact
Free for editorial and educational reuse with attribution. Please credit VELOFITZONE Calculator Benchmark 2026 and link to the original research page.
References
- National Academy of Sports Medicine (NASM). Calorie Calculator.
- Omni Calculator. Calorie Intake Calculator (Simple).
- Calculator.net. Calorie Calculator.
- Australian Government / Eat For Health. Dietary energy.
- Mifflin MD, St Jeor ST, Hill LA, Scott BJ, Daugherty SA, Koh YO. A new predictive equation for resting energy expenditure in healthy individuals. American Journal of Clinical Nutrition. 1990.
- Schofield WN. Predicting basal metabolic rate, new standards and review of previous work. Human Nutrition: Clinical Nutrition. 1985.
- Frankenfield D, Roth-Yousey L, Compher C. Comparison of predictive equations for resting metabolic rate in healthy nonobese and obese adults. Journal of the American Dietetic Association. 2005.